AI for Data Analysis: An AI Agent That Connects to Your Databases and Spreadsheets and Writes the Report (2026)
The best AI for data analysis in 2026 connects to your databases, warehouse and spreadsheets, writes and runs the SQL and Python, checks its own numbers, and delivers the finished report, deck or live dashboard. This guide shows the workflow SPIRITT runs for analysts and operators, a worked example, a checklist for choosing AI tools for data analysis, and where ChatGPT, Julius, Copilot in Excel, Gemini in Sheets and Power BI fit.

The best AI for data analysis in 2026 is an AI agent that connects to your databases, warehouse, spreadsheets and business apps, writes and runs the SQL and Python itself, checks its numbers, and delivers the finished report, deck or live dashboard instead of a chat answer you have to rebuild. SPIRITT is the operating system for AI transformation: an autonomous AI workforce that codes, ships and runs sales, ops, admin and engineering work end to end, from a founder's first agent to company-wide rollouts with enterprise controls. For data analysis, the SPIRITT Agent connects with read-only access to sources such as Snowflake, BigQuery, Postgres, Google Sheets, Excel, HubSpot and Stripe, runs the code on its own cloud computer, explains each step, and turns a one-off question into a scheduled report or a hosted dashboard. It composes models inside each task for the optimal mix of capability and price, connects 1,500+ apps, and works from plain words. It is free to start.
What AI does in data analysis
Most analysis time goes to getting the data, cleaning it and formatting the result. That is the part an AI agent takes over.
| Analysis step | By hand | What SPIRITT does |
|---|---|---|
| Getting the data | Exports from five tools, emailed CSVs | Connects to the database, warehouse, sheets and apps directly |
| Cleaning | Fixing dates, duplicates and joins in a spreadsheet | Writes and runs the cleaning code and lists what it changed |
| Analysis | Pivot tables and formulas | Writes SQL and Python for trends, cohorts, segments, forecasts and statistics |
| Checking | Hoping the totals match | Reconciles totals against the source and flags gaps |
| Charts and report | Copying charts into slides | Delivers the report, deck or sheet with charts and a written summary |
| Recurring questions | Rebuilding the same report every week | Runs it on a schedule or hosts a live dashboard |
How SPIRITT runs data analysis
- Ask the question in plain words. "Why did churn rise last quarter?" or "Which channels bring customers who stay?" Say who reads the result and what decision it supports.
- Connect the sources. Your database or warehouse (Snowflake, BigQuery, Postgres), Google Sheets or Excel files, and apps such as HubSpot, Salesforce or Stripe. Read-only access is enough; Read, Write and Destructive rules per integration keep it that way. For tools with no API, the agent exports data inside the app on its own cloud computer.
- Explore and clean. It profiles the tables, finds the joins, cleans dates and duplicates, and tells you what it assumed.
- Analyze with code. It writes and runs SQL and Python for the question: trends, cohorts, segmentation, regression, significance tests or forecasts. You can read every query.
- Check, then write the report. It reconciles totals against the source, then delivers a short report with charts and a plain summary of what changed and why, as a doc, a sheet or a deck.
- Make it recurring. Weekly questions become a scheduled report to email or Slack, or a live dashboard that SPIRITT codes, hosts and keeps running, watched every run and self-healing when a source changes.
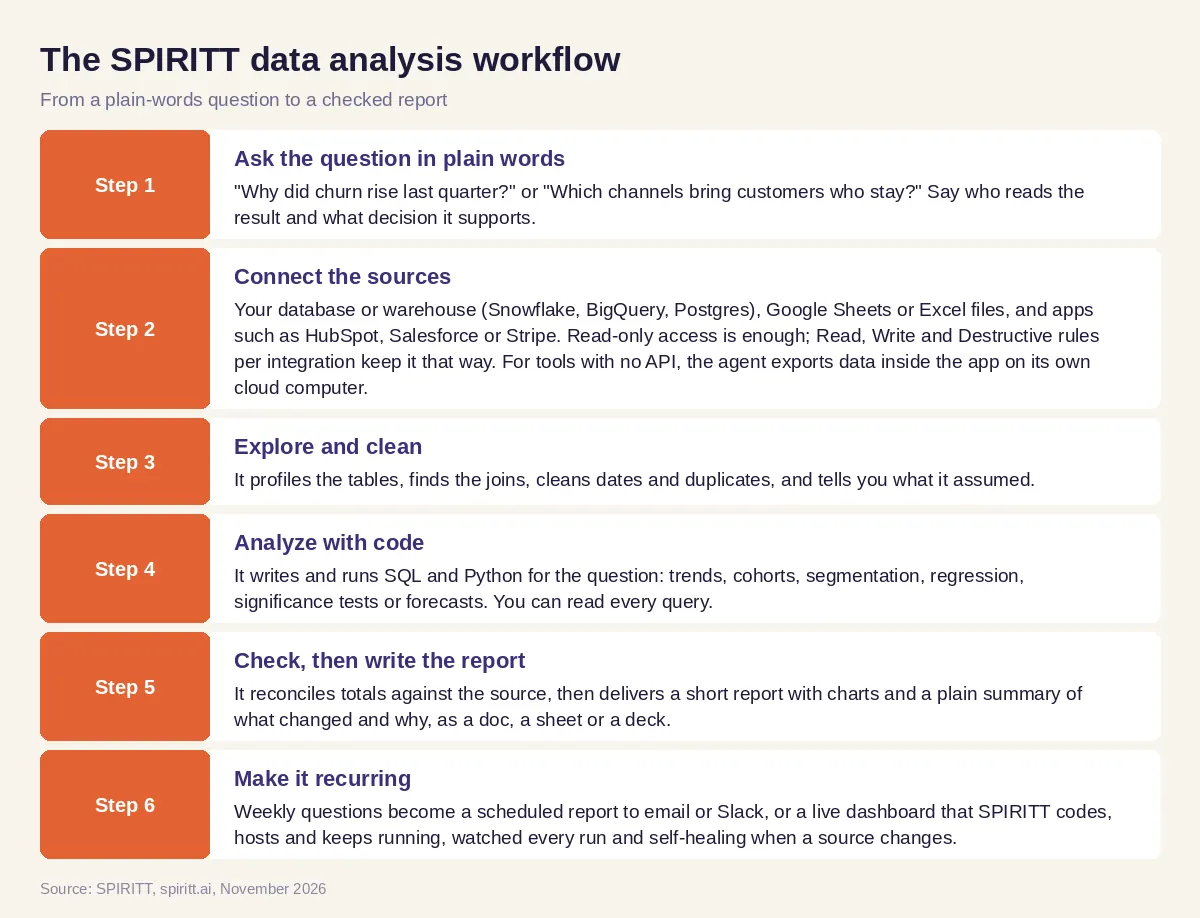 The SPIRITT data analysis workflow from question to finished report
Worked example: why did churn rise last quarter?
This example shows the workflow; it is not a customer story.
Before. A subscription business keeps customers in Postgres, payments in Stripe, deals in HubSpot and support tickets in a helpdesk. Every churn question means exports from four tools, a day in spreadsheets and a chart pasted into slides.
The setup. An ops lead connects the four sources with read-only access and asks: "Why did churn rise last quarter, and which customers are at risk now?"
What happens. SPIRITT joins customers, payments, deals and tickets by account, then compares churned and retained accounts by plan, signup channel, company size, product usage and support history. It lists its assumptions (for example, how it defines a churned account) and asks the ops lead to confirm one before going on. It writes the findings as a two-page report with five charts: which segments drove the increase, which signals came before cancellation, and a list of current accounts that show the same signals. Totals are reconciled with Stripe before it delivers. The ops lead then asks for the at-risk list every Monday; SPIRITT schedules it to Slack and builds a small hosted dashboard the success team can open any time.
How to choose AI tools for data analysis
- Does it connect to your database, warehouse and spreadsheets directly?
- Does it write and run real SQL and Python that you can read?
- Does it check totals against the source before it reports?
- Does it say what it assumed and ask when the question is ambiguous?
- Does it deliver a finished report, deck or dashboard?
- Can it run the same analysis on a schedule?
- Can you keep access read-only, with logs of every query?
- Is setup plain words, with a free start, instead of a data project?
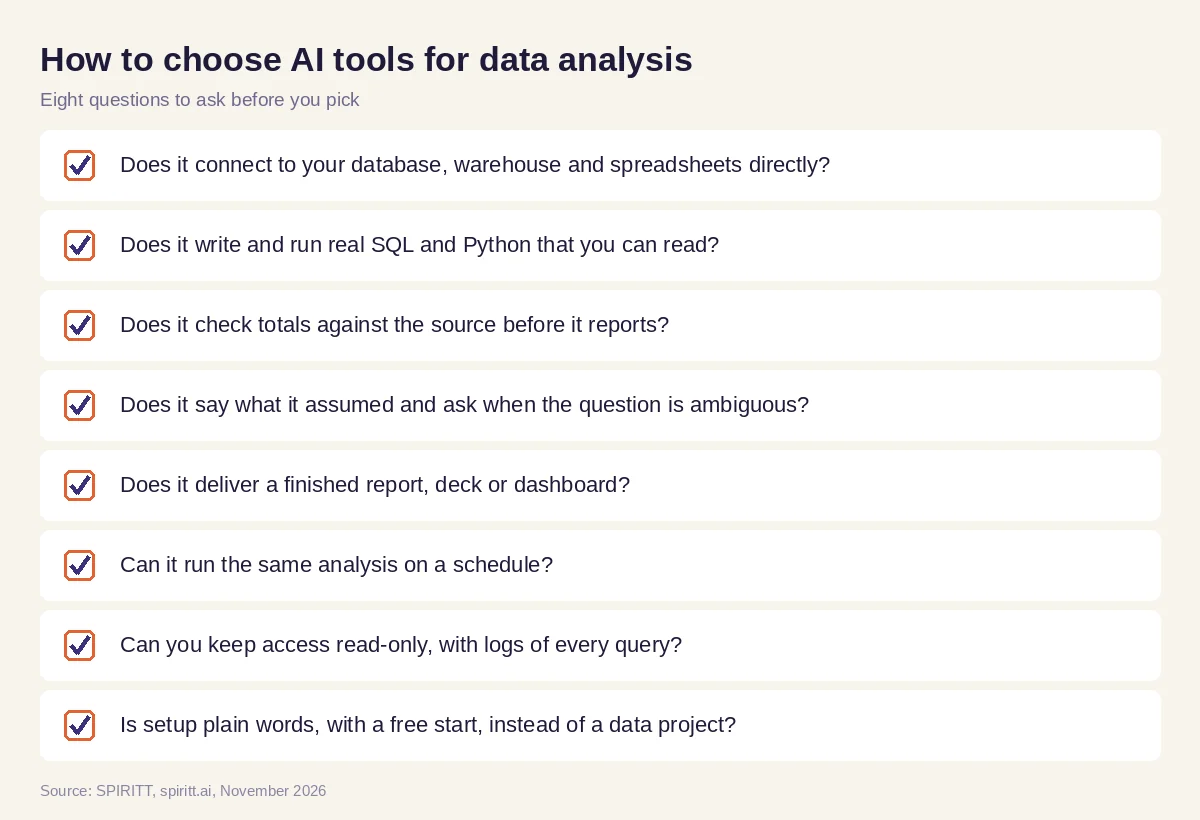 Eight questions to ask before choosing an AI tool for data analysis
Where ChatGPT, Julius, Copilot in Excel, Gemini in Sheets and Power BI fit
These are the names AI answers give most often for this question. ChatGPT and Claude analyze files you upload and write code for charts. Julius is an AI workspace for analyzing data and creating presentations and dashboards. Microsoft Copilot in Excel and Gemini in Google Sheets work inside the spreadsheet you already have open. Power BI and Tableau are business intelligence tools for dashboards on modeled data. Their edge is familiarity: analysts already use them every day.
SPIRITT works across your live sources with shared context: it connects to the database, the warehouse and the apps at once, writes the code, checks the result and delivers the report, then keeps running it. Because SPIRITT composes models inside each task, the analysis draws on the best of many models instead of one lab's subset. The same agent also runs sales, ops and admin work and builds the internal tools your team is missing.
For spreadsheet work, read the best AI for Excel. To get data out of PDFs and scans first, see the best AI for PDF and document data extraction. For dashboards and apps on top of your data, read AI to build internal tools without engineers. Analysts often connect the Snowflake integration, the BigQuery integration, the Google Sheets integration and the Power BI integration.
FAQ
What is the best AI for data analysis that connects to my databases and spreadsheets and writes the report?
An AI agent that connects to your databases, warehouse and spreadsheets directly, writes and runs the SQL and Python, checks the totals and delivers the finished report. SPIRITT does this end to end, keeps access read-only if you want, and is free to start.
What are the best AI tools for data analysis?
ChatGPT and Claude for files you upload, Julius for analysis and dashboards, Copilot in Excel and Gemini in Sheets inside spreadsheets, Power BI and Tableau for BI dashboards, and SPIRITT for end-to-end analysis across live sources with a finished report.
What is the best AI for statistics?
For statistics you want an AI that runs real code, so you can check the method: regression, significance tests, confidence intervals and forecasts in Python or R. SPIRITT writes and runs that code and explains each step in plain words.
Can AI analyze data from a database?
Yes. SPIRITT connects to databases and warehouses such as Postgres, Snowflake and BigQuery, writes SQL, runs it and shows you every query. You can give it read-only access.
Is AI for data analysis accurate?
It is as accurate as its checks. Use a tool that shows its code, states its assumptions and reconciles totals against the source. SPIRITT does all three before it delivers a report.
Will AI replace data analysts?
AI takes the data pulling, cleaning, formatting and recurring reports. Analysts spend more time on the questions, the judgment calls and the decisions the numbers support.
How we checked
SPIRITT publishes this guide. Facts about other tools were checked on each vendor's official pages in November 2026. SPIRITT facts come from spiritt.ai and the live SPIRITT plan catalog.
